Note
Go to the end to download the full example code.
How to get started with the Spatiocoexistence model
This example demonstrates basic usage of the Spatiocoexistence model.
Necessary imports
import numpy as np
import matplotlib.pyplot as plt
Create example data
x = np.linspace(0, 10, 100)
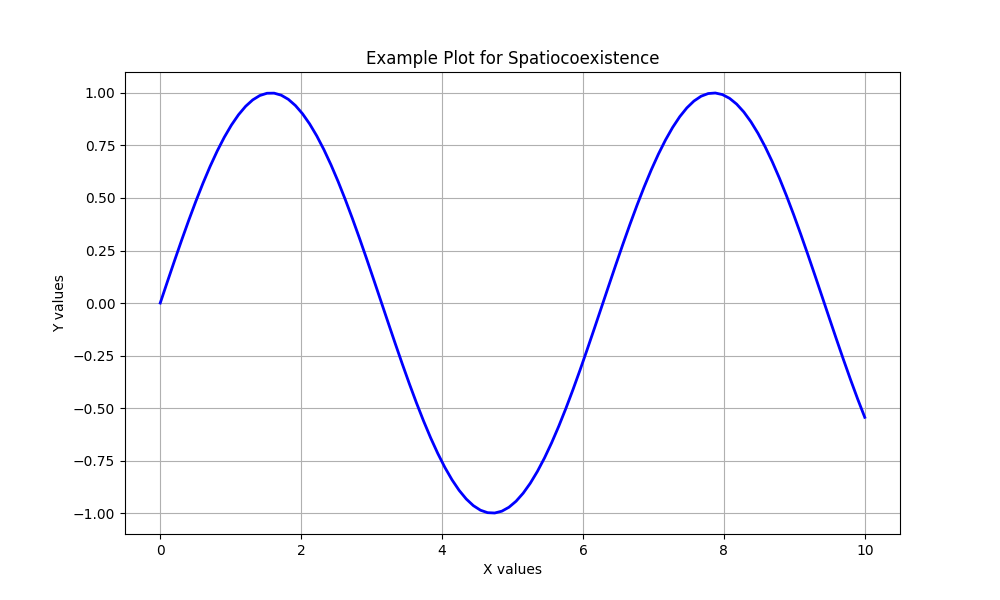
y = np.sin(x)
Generate a plot (REQUIRED for gallery thumbnail)
plt.figure(figsize=(10, 6))
plt.plot(x, y, "b-", linewidth=2)
plt.xlabel("X values")
plt.ylabel("Y values")
plt.title("Example Plot for Spatiocoexistence")
plt.grid(True)
plt.show()

Total running time of the script: (0 minutes 0.087 seconds)