Note
Go to the end to download the full example code.
How to get started with the calculation of crowding indices
This example demonstrates how to get the crowding indices.
Necessary imports
from spatiocoexistence.crowding import crowding_indices
import numpy as np
import matplotlib.pyplot as plt
Generate random point data
n = 100000
x_dimension = 1000
y_dimension = 2000
x = np.round(np.random.uniform(0, x_dimension, n), 2)
y = np.round(np.random.uniform(0, y_dimension, n), 2)
species = np.random.randint(0, 10, n)
dbh = np.random.uniform(1, 10, n)
status = np.random.randint(-2, 1, n).astype(np.int32)
radius = 10
Calculate the crowding indices in serial computation
CI, HI, CI_D, HI_D = crowding_indices(
    x,
    y,
    species,
    status,
    radius,
    cell_size=radius,
    dbh=dbh,
    domain_x=x_dimension,
    domain_y=y_dimension,
    num_threads=1,
)
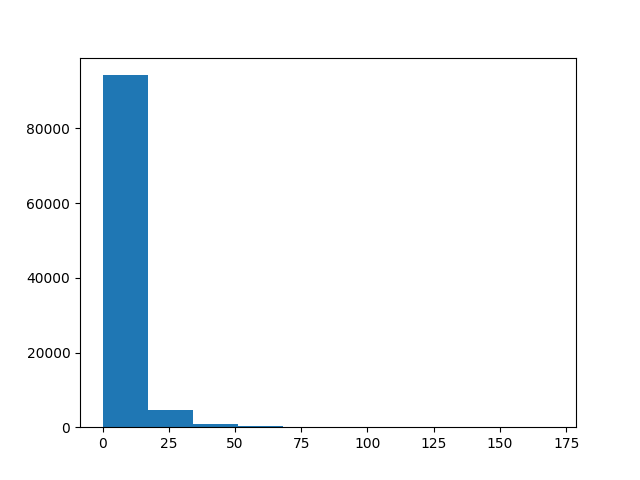
Plot the conspecific crowding indices
plt.figure()
plt.hist(CI)
plt.show()
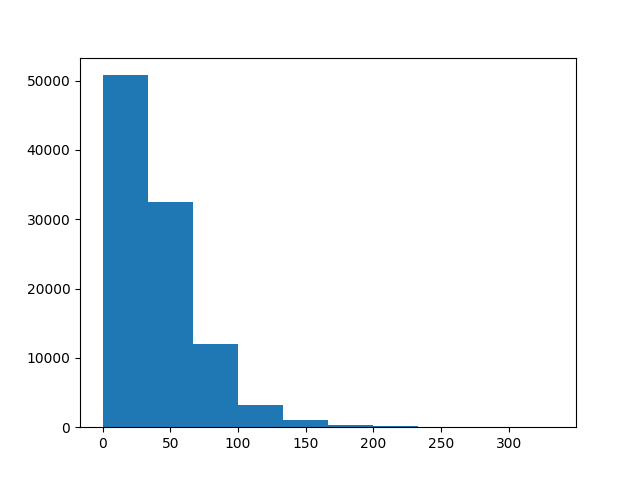
Plot the conspecific crowding indices
plt.figure()
plt.hist(HI)
plt.show()
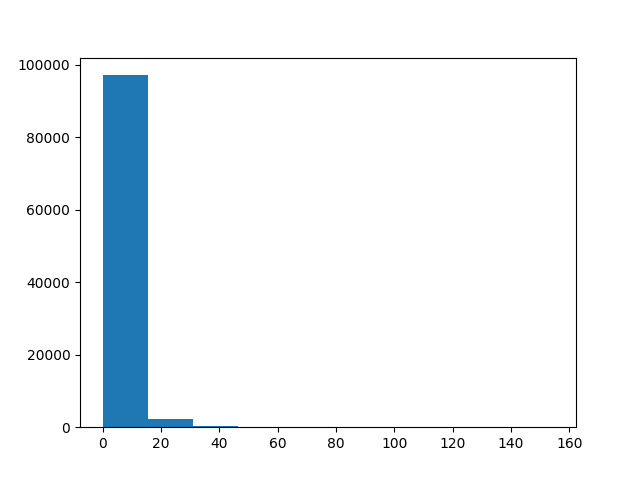
Plot the conspecific crowding indices
plt.figure()
plt.hist(CI_D)
plt.show()
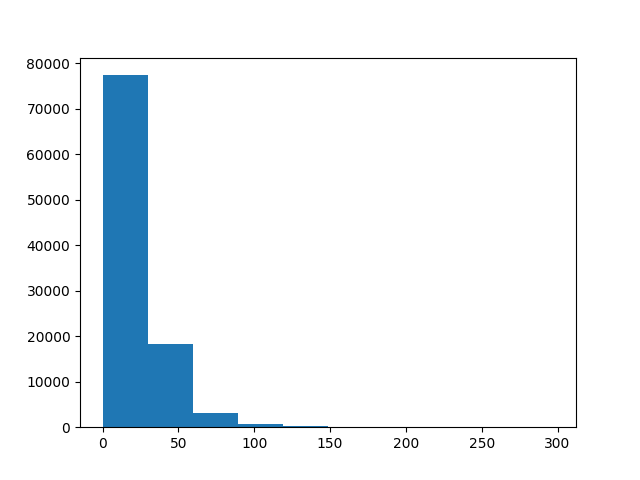
Plot the conspecific crowding indices
plt.figure()
plt.hist(HI_D)
plt.show()
Total running time of the script: (0 minutes 0.381 seconds)